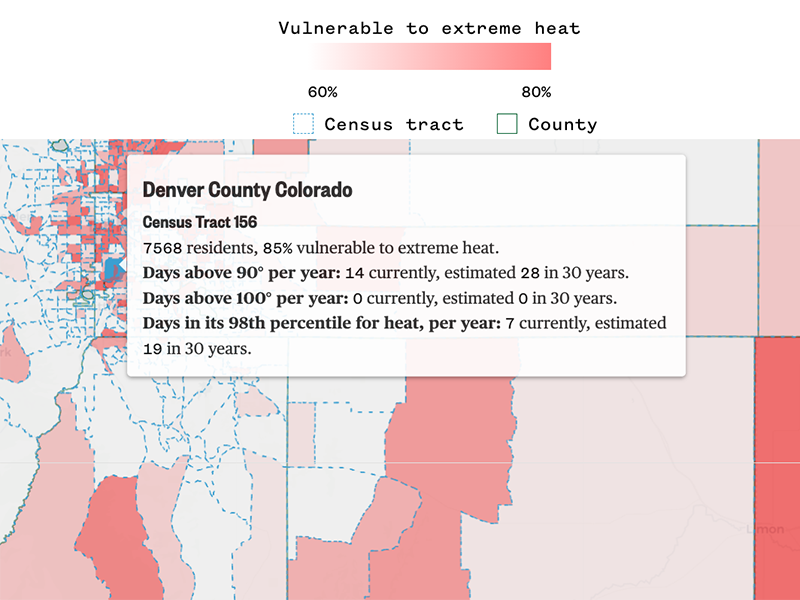
Built an accessible interactive map with custom tilesets that lets readers drill down to community heat vulnerability data on the census tract level.
The team developer and I made a map using leaflet and tilesets tuned to the zoom level (state / county / census tract) that shows readers how vulnerable their community is to extreme heat. This involved new Census Bureau data, and we folded in extreme heat forecasts from the First Street Foundation.
What I did
- Map tileset scripting and creation
- Data collection, cleaning, munging and analysis
- Map creation
- Scoped and assigned the accessibility work
Heat vulnerability map project links
Map: How vulnerable is your neighborhood to excessive heat?ulnerable-your-neighborhood-rcna84